


Key takeaways:
- Chainlink price prediction for 2024 could reach a maximum value of $19.29
- By 2027, LIINK could reach a maximum price of $65.89.
- In 2030, Chainlink will range between $22.01 to $210.99.
Chainlink (LINK) has emerged as a prominent player in the cryptocurrency market, providing a decentralized oracle network that connects smart contracts with real-world data. As the adoption of decentralized finance (DeFi) and blockchain technology continues to grow, Chainlink’s innovative solutions have attracted significant attention from investors and developers alike.
Understanding Chainlink’s potential price movements involves analyzing various factors such as market trends, technological advancements, partnerships, and overall market sentiment. This price prediction aims to provide insights into Chainlink’s future performance by examining both technical analysis and fundamental aspects that could influence its value
Overview
| Cryptocurrency | Chainlink |
| Token | LINK |
| Price | $10.58 |
| Market Cap | $6,475,463,082 |
| Trading Volume | $221,444,068 |
| Circulating Supply | 608,099,970 |
| All-time High | $52.88 May 09, 2021 |
| All-time Low | $0.1263 Sep 23, 2017 |
| 24-h High | $13.37 |
| 24-h Low | $11.27 |
Chainlink price analysis: LINK reaches $10.00 as market consolidates
Chainlink (LINK) analysis for 20 August, 2024. LINK has notably stabilized above the $10.00 mark despite recent market fluctuations impacting the broader cryptocurrency landscape. This stability is part of a more expansive consolidation phase within a horizontal channel, where LINK has been trading with defined resistance at $10.78 and support at $10.06. Chainlink’s resilience in holding its ground above the $10.00 level reflects a cautious optimism among traders, balancing buying and selling pressures without a clear directional bias.
A close examination of LINK’s trading patterns shows it hovering around $10.14, closely aligned with its immediate support level. This positioning within the horizontal channel suggests a potential tightening of price movements, often preceding more significant price fluctuations. Despite the present stability, Chainlink’s market dynamics hint at underlying opportunities. On-chain data reflects a cautious market sentiment, with more transactions resulting in losses than profits. This suggests that sellers are reluctant to exit at current price levels, which could limit downward pressure on LINK’s price.
Looking ahead, the LINK’s market value to realized value (MVRV) ratios, particularly the 30-day and 90-day ratios, present a compelling narrative for potential buyers. These ratios are often used in negative territory as counter-indicators, suggesting that LINK might be undervalued and poised for a price correction upwards.
LINK daily chart price analysis: LINK faces resistance at key technical levels Amid consolidation phase
Chainlink (LINK) is currently navigating a challenging technical landscape, as indicated by its recent trading activity on the daily chart. The price of LINK has been on a gradual decline, evidenced by its position below all key moving averages (50-day, 100-day, and 200-day SMAs), traditionally viewed as indicators of the asset’s medium to long-term trajectory. Notably, the 50-day SMA has crossed below the 200-day SMA, a bearish signal often referred to as a “death cross,” suggesting that bearish momentum could strengthen. Despite these bearish indicators, LINK has found some short-term support around the $10.115 level, though it faces significant resistance at $10.728, which could be pivotal in determining its near-term direction.

The Relative Strength Index (RSI) is hovering just below the neutral 40 mark, which signals a lack of solid buying momentum but also indicates that LINK is not yet in the oversold territory. This could suggest a potential for stabilization or a slight recovery if bullish catalysts emerge. However, the MACD (Moving Average Convergence Divergence) shows a different aspect of the market sentiment, with the MACD line slightly above the signal line, but both trends are below zero.
LINK 4-hour chart analysis: Bears hold firm as resistance levels tighten
Chainlink (LINK) remains under pressure in the 4-hour chart, showcasing difficulty breaking key resistance levels. The price of LINK has consistently faced hurdles near the $10.285 mark, which aligns with the 50-period Exponential Moving Average (EMA), suggesting a solid bearish influence in the market. Above this, further resistance is found at the 100-period and 200-period EMAs, plotted at $10.685 and $11.504, respectively. These moving averages trend downward, reinforcing the resistance levels and highlighting a lack of bullish momentum to increase prices.

The Moving Average Convergence Divergence (MACD) indicator presents a subtle hint of bullish potential as it hovers just above the signal line, indicating slight buying momentum. However, this signal is weak given the bearish context, with the MACD and signal lines remaining close to the zero line. The Relative Strength Index (RSI) is somewhat neutral at around 46.95, suggesting neither oversold nor overbought conditions, which aligns with the ongoing sideways trading pattern seen in recent sessions. This neutrality in the RSI further reflects the market’s uncertainty, leaving LINK in a precarious position where any significant market news or shift in trader sentiment could prompt a decisive upward or downward movement.
Chainlink price prediction: Technical analysis
| Price Prediction | $20.05 (53.24%) |
| Volatility | 8.40% |
| 50-Day SMA | $15.77 |
| 14-Day RSI | 40.76 |
| Sentiment | Bearish |
| Fear & Greed Index | 44 (Fear) |
| Green Days | 13/30 (43%) |
| 200-Day SMA | $16.36 |
Chainlink technical indicators: Levels and action
Daily simple moving average (SMA)
| Period | Value | Action |
| SMA 3 | $14.34 | SELL |
| SMA 5 | $14.05 | SELL |
| SMA 10 | $14.19 | SELL |
| SMA 21 | $14.42 | SELL |
| SMA 50 | $15.77 | SELL |
| SMA 100 | $15.69 | SELL |
| SMA 200 | $16.36 | SELL |
Daily Exponential Moving Average (EMA)
| Period | Value | Action |
| EMA 3 | $14.13 | SELL |
| EMA 5 | $14.07 | SELL |
| EMA 10 | $14.15 | SELL |
| EMA 21 | $14.68 | SELL |
| EMA 50 | $15.34 | SELL |
| EMA 100 | $15.76 | SELL |
| EMA 200 | $15.32 | SELL |
Is Chainlink a good investment?
Chainlink represents a robust investment opportunity due to its pivotal role in linking external data to blockchains through its decentralized oracle network, which is crucial for the functionality of smart contracts, especially in DeFi. Its strategic collaborations with major blockchain platforms and traditional finance entities, such as Coinbase Cloud, enhance its reliability and expand its use cases across various industries. This interoperability and the essential nature of its services position Chainlink as a key player in the blockchain ecosystem, making it an attractive option for investors looking for growth potential in the cryptocurrency market.
Will Chainlink recover?
Chainlink’s price has declined recently, with minor short-term recoveries; however, the move is gradual. The general trend remains bearish as it seeks support.
Will Chainlink reach $15?
Chainlink price shows a recent decline with some stabilization, predicting whether Chainlink will reach $15 is uncertain.
Will Chainlink reach $100?
It is highly speculative to predict if Chainlink will reach $100.
Does Chainlink have an excellent long-term future?
Chainlink shows some stabilization and potential for recovery, indicating the token may have a promising long-term future.
Recent news/opinion on Chainlink
Chainlink (LINK) has recently made significant strides with new integrations on the Base platform, an Ethereum Layer 2 solution. This expansion includes the deployment of Chainlink Data Streams and Verifiable Random Functions (VRF), enhancing Chainlink’s capabilities on Base. The Data Streams service provides developers with real-time access to external data, facilitating more efficient interactions between decentralized applications and off-chain data sources.
Furthermore, Chainlink’s VRF offers a robust source of randomness, crucial for the security and fairness of decentralized applications. Thodoris Karakostas, Head of Blockchain Partnerships at Chainlink Labs, expressed enthusiasm about the synergy between Base’s developer-friendly environment and Chainlink’s technologies, which could significantly boost the adoption and utility of LINK tokens within the DeFi sector. This series of integrations reaffirms Chainlink’s commitment to broadening its impact in decentralized finance, potentially increasing the intrinsic value and demand for LINK.
Chainlink price prediction August 2024
In August 2024, Chainlink’s price is estimated to be between $9.96 and $10.79, and its average cost is expected to be around $10.68.
| Chainlink Price Prediction | Potential Low ($) | Average Price ($) | Potential High ($) |
| Chainlink Price Prediction August 2024 | $9.96 | $10.68 | $10.79 |
Chainlink Price Prediction 2024
After analyzing the prices of Chainlink in previous years, it is assumed that in 2024, the minimum price of LINK will be around $9.96. The maximum expected LINK price may be around $10.79. On average, the trading price might be $10.68 in 2024.
| Chainlink Price Prediction | Potential Low ($) | Average Price ($) | Potential High ($) |
| Chainlink price prediction 2024 | $9.96 | $10.68 | $10.79 |
Chainlink price prediction 2025-2030
| Year | Minimum | Average | Maximum |
| 2025 | $26.15 | $27.05 | $30.05 |
| 2026 | $38.22 | $39.30 | $46.48 |
| 2027 | $56.82 | $58.78 | $65.89 |
| 2028 | $80.82 | $83.76 | $99.62 |
| 2029 | $118.71 | $122.90 | $142.51 |
| 2030 | $172.44 | $178.58 | $210.99 |
Chainlink Price Prediction 2025
In 2025, the price of Chainlink is expected to reach a minimum value of $26.15. The LINK price can reach a maximum value of $30.05, with an average value of $27.05.
Chainlink Price Prediction 2026
The price of Chainlink is expected to reach a minimum level of $38.22 in 2026. The LINK price can reach a maximum level of $46.48, with an average price of $39.30 throughout 2026.
Chainlink Price Prediction 2027
The price of Chainlink is predicted to reach a minimum level of $56.82 in 2027. The Chainlink price can reach a maximum level of $65.89, with an average price of $58.78 throughout 2027.
Chainlink Price Prediction 2028
Chainlink’s price is forecast to reach the lowest possible $80.82 in 2028. As per our findings, the LINK price could reach the maximum possible level of $99.62 with the average forecast price of $83.76.
Chainlink Price Prediction 2029
The Chainlink price is forecast to reach its lowest possible level of $118.71 in 2029. According to our findings, the LINK price could reach its maximum possible level of $142.51, with an average forecast price of $122.90.
Chainlink Price Prediction 2030
The price of Chainlink is predicted to reach a minimum value of $172.44 in 2030. The Chainlink price could reach a maximum value of $210.99, with an average trading price of $178.58 throughout 2030.

Chainlink market price prediction: Analysts’ OP price forecast
| Firm | 2024 | 2025 |
| Gov.Capital | $27.41 | $53.94 |
| DigitalCoinPrice | $38.64 | $45.46 |
| Coindex | $23.00 | $ 75.86 |
Cryptopolitan’s Chainlink price prediction
According to our Chainlink price forecast, the coin’s market price might reach a maximum value of $26.06 by the end of 2024. In 2026, the value of LINK could surge to $55.40.
Chainlink’s historic price sentiment
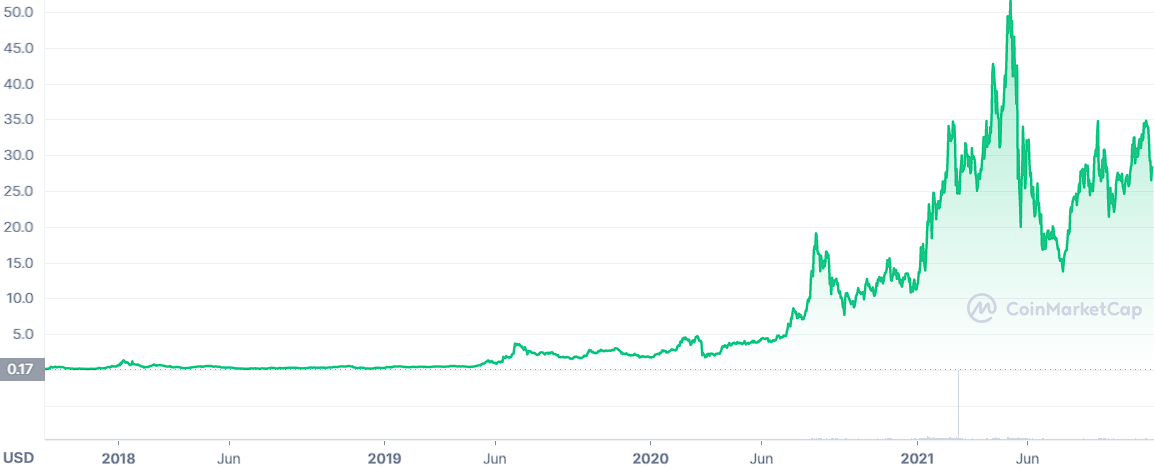
- 2018 began with a strong bullish rally, and most digital assets were at their summit. Chainlink token was not an exception. However, after that, a sharp freefall in the altcoins market resulted in billions of dollars being wiped out.
- 2019 was a very significant year for Chainlink. Its token LINK was performing very impressively in the market. The performance is heavily associated with the pioneering DApps on the Chainlink network and listing by a few crypto exchanges, such as Bitbox, the previous year.
- This drove the LINK price from $0.3 at the beginning of the year to a record $1.13 by May 2019. The oracle coin broke its ATH twice that year, and on June 24, 2019, LINK’s price reached a record $4.540. The release of the Chainlink network on the Ethereum main network heavily drove the bullish rally.
- In 2020, the Chainlink project emerged as the top performer of all cryptocurrencies, beating significant cryptocurrencies like Bitcoin and Ethereum for the second year. Bitcoin price The massive rally was heavily connected to the 2020 DeFi craze.
- LINK began trading at around $1.70 and hiked toward $4.570 in February. It remained quiet until mid-July, when the price rallied toward a new ATH at $8.40. The rally continued, and Chainlink’s digital asset price almost hit $20 but faced rejection and pulled back to under $12.
- In 2021, Chainlink’s price enjoyed a strong bull run, as wavelike bullish activity caused the price to rise from $12.00 to recent highs of $36.00.
- Chainlink’s price faced strong resistance at the $36 mark, which it could not break through and was rejected. The rejection caused the price to fall to $23.50 before it bounced back to the $30 support level.
- Afterwards, the coin reached its all-time high of $52.88 in May and started falling. The fall in the price of Bitcoin affected Chainlink until it was $30.
- Chainlink’s price trend was upward between May and June. For the year, it registered its highest price at $18.44.
Dieser Beitrag ist ein öffentlicher RSS Feed. Sie finden den Original Post unter folgender Quelle (Website) .
Unser Portal ist ein RSS-Nachrichtendienst und distanziert sich vor Falschmeldungen oder Irreführung. Unser Nachrichtenportal soll lediglich zum Informationsaustausch genutzt werden. Die auf dieser Website bereitgestellten Informationen stellen keine Finanzberatung dar und sind nicht als solche gedacht. Die Informationen sind allgemeiner Natur und dienen nur zu Informationszwecken. Wenn Sie Finanzberatung für Ihre individuelle Situation benötigen, sollten Sie den Rat von einem qualifizierten Finanzberater einholen. Kryptohandel hat ein großes Handelsrisiko was zum Totalverlust führen kann.


